2.2.2.1. Creation of dictionaries
I implemented a script in R allowing to convert csv files into Unitex dictionaries. These csv files contain the ecosystem services forms and the entities concerning ecosystem services extracted by Elise Tancoigne with CorTexT:
- 751 forms of ecosystem services extracted with Cortext
- 34 forms validated by experts
- entities
- resilience
Generated dictionaries have the following format: form,main form.type of dictionary+category1+category2
The result of this script are these dictionaries:
- Dictionary 1 about ecosystem services: 34 forms validated by experts (se1)
- Dictionary 2 about ecosystem services: 751 forms (se2)
- Dictionary of entities
- Dictionary of the resilience theme
2.2.2.2. Creation of graphs
I have created 39 graphs with Unitex. These graphs are divided in 7 categories:
- Verbal forms
- Goal/Expected
- Composed graphs
- Ecosystem services
- Ecosystems
- Themes
- Entities
It can be download here: graphs.zip
The documentation of these graphs can be download here: description_graphes_v1.xls
2.2.2.2.1 Verbal forms
The verbal forms’ graphs have created to characterize verbal tenses used in projects and observe the context which the verbs are used, in order to propose other graphs. There are three types of verbal forms’ graphs:
- « Future » graph which recognizes all future verbal forms (Figure 1)
- « Past » graph which recognizes all past verbal forms (Figure 2)
- « Present » graph which recognizes all present verbal forms (Figure 3)
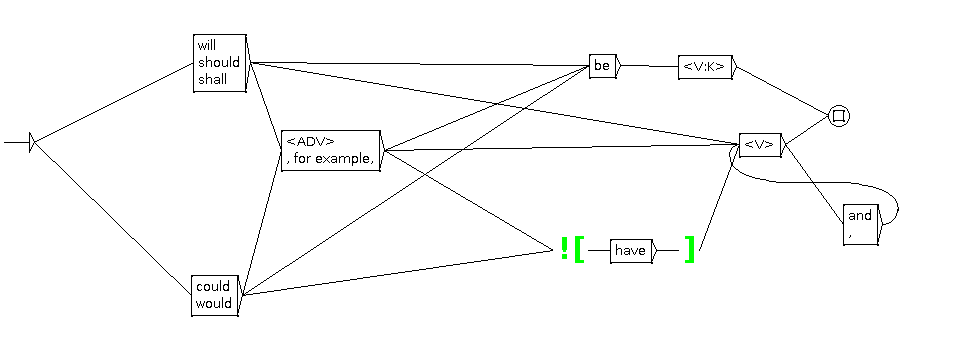
Figure 1: Future
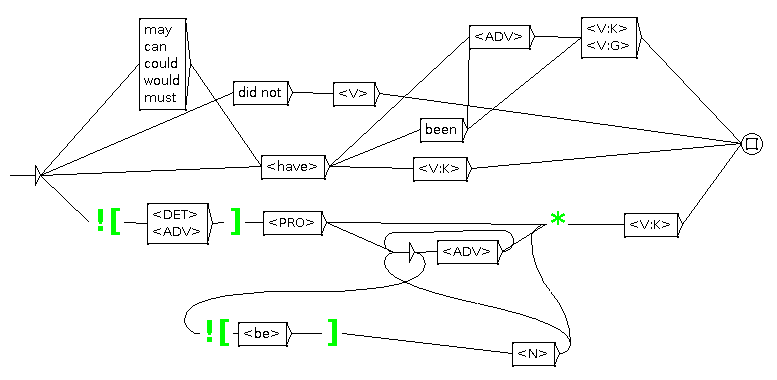
Figure 2: Past
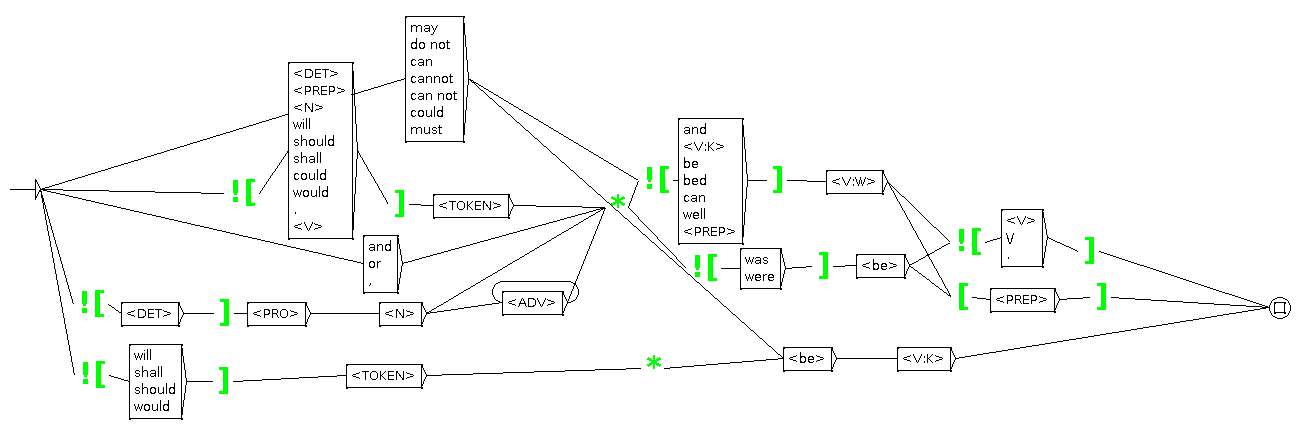
Figure 3: Present
2.2.2.2.2. Goals/Expected
The graphs of goals and expected (Figures 4 and 5) allow to know if authors of project abstracts have defined goals and expected of their project.
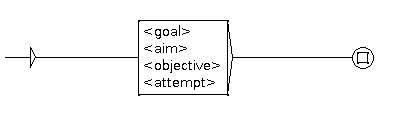
Figure 4: Goals
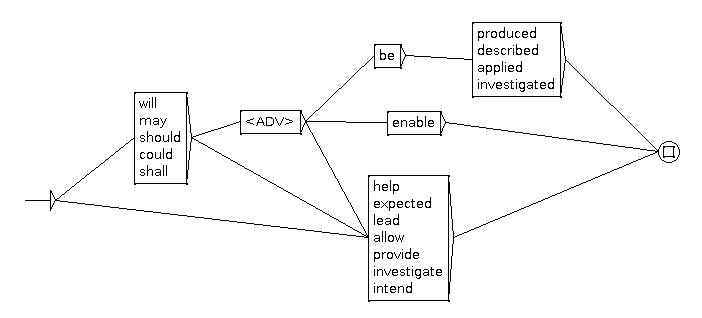
Figure 5: Expected
2.2.2.2.3. Composed graphs
The concordances of graphs on verbal forms, goals and expected of a project don’t allow to determine if a project talks about ecosystem services or if it refers to methods and techniques. That’s why, I created the graphs goal_se2, expected_se2, future_se2, present_se2, past_se2 allowing to filter the lines of projects which contain ecosystem services forms.
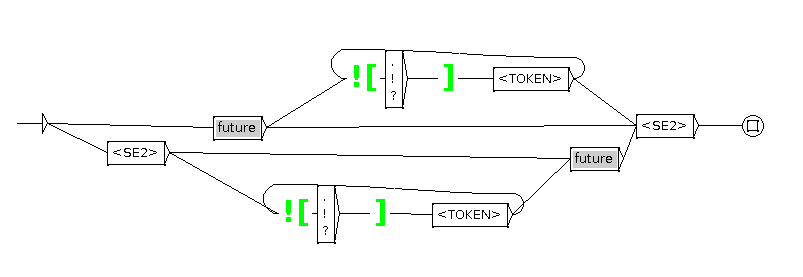
Figure 6: Future and ecosystem services
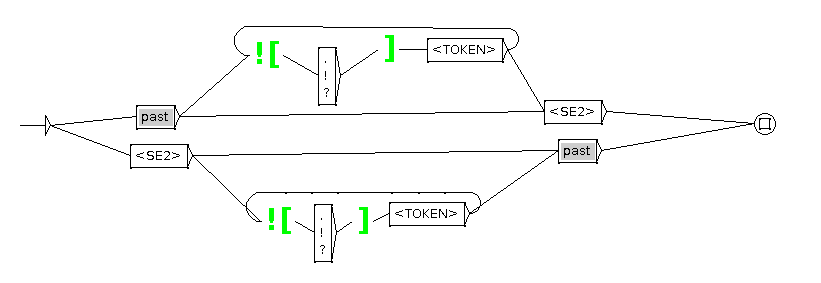
Figure 7: Past and ecosystem services
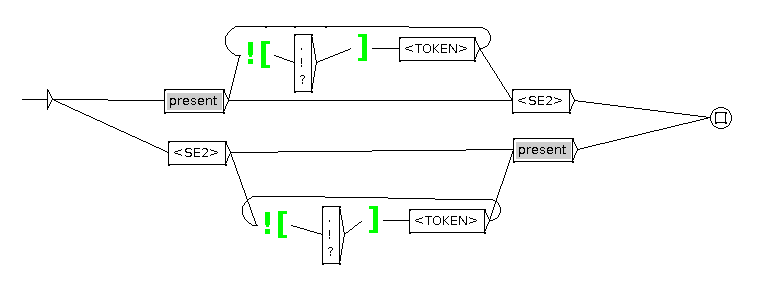
Figure 8: Present and ecosystem services
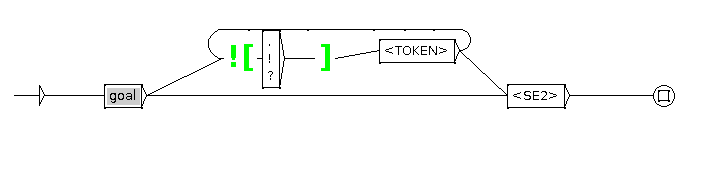
Figure 9: Goals and ecosystem services

Figure 10: Expected and ecosystem services
By observing the concordances files of these graphs, we can notice the presence of methods, approaches, techniques, experiments, prediction, models, process, mecanisms and keywords indicating that researchers of the project seek to measure, identify, analyse, quantify, understand something in relation with ecosystem services. I have therefore established a list of keywords that may indicate a level 3:
<mecanism>+<model>+<approach>+<experiment>+<technique>+<process>+<pattern>+<understand>+<analyse>+<identify>+<method>+<relationship>+<methodology>+<quantify>+<predict>+<measure>+<investigate>+<linkage>+<link>+<association>+<interaction>+<relation>+<dynamic>
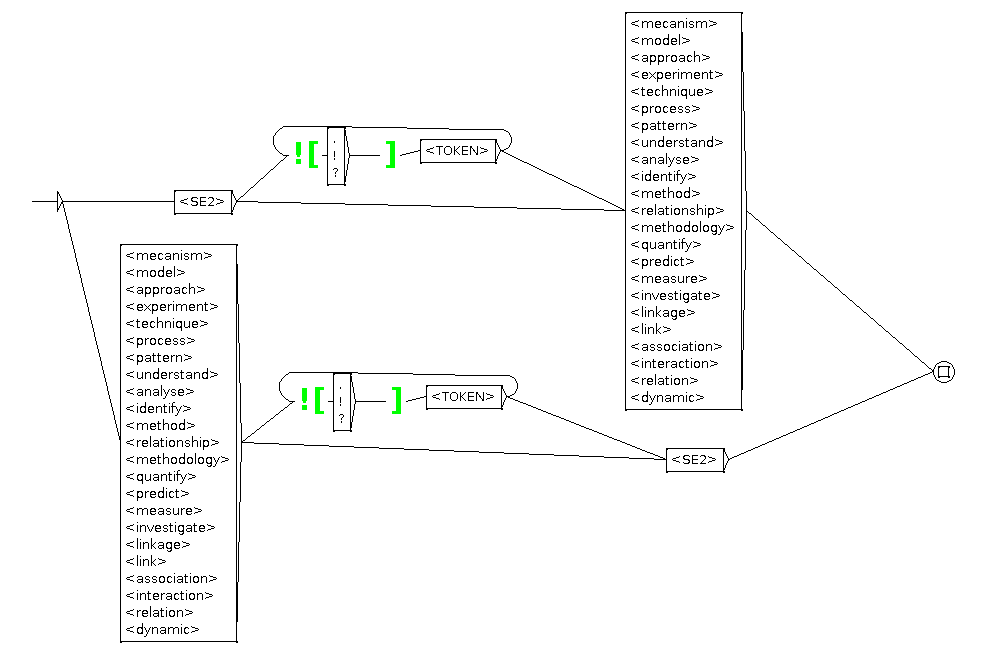
Figure 11: Ecosystem services and keywords of level 3
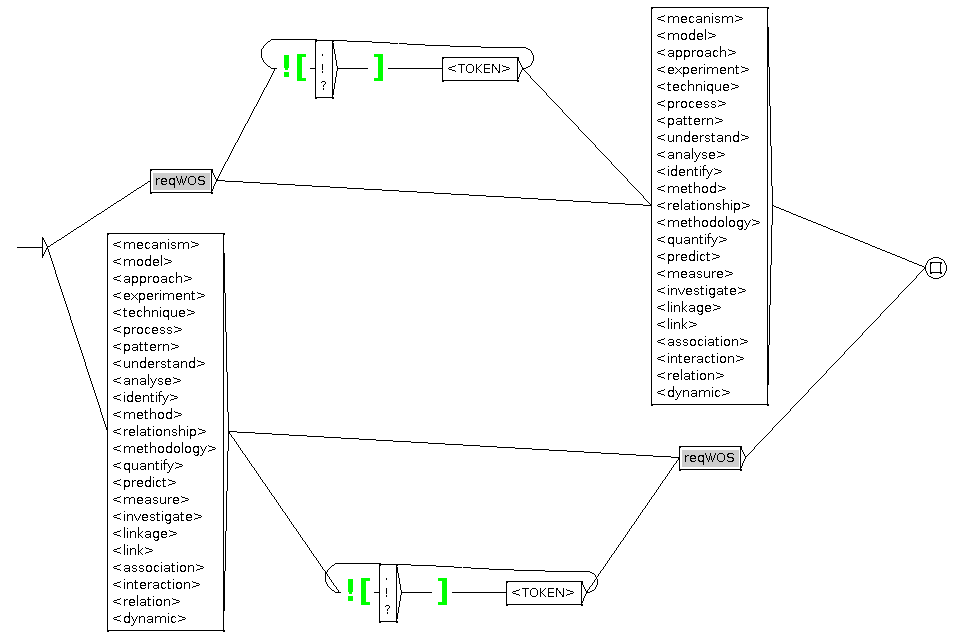
Figure 12: Query WOS and keywords of level 3
2.2.2.2.4. Ecosystem services
I have constructed 11 graphs about ecosystem services:
- Graph which recognizes the expression « ecosystem service » (Figure 13)
- Graph which recognizes the expression « ecosystem function » (Figure 14)
- Graph which recognizes a service or a function (Figure 15)
- Graph which recognizes a production or provision of ecosystem services (Figure 16)
- Graph which recognizes the Elise Tancoigne’s query (Figure 17)
- Graph which recognizes the dictionary 1 of ecosystem services se1 (Figure 18)
- Graph which recognizes the dictionary 2 of ecosystem services se2 (Figure 19)
- Graphs which recognize the four types of ecosystem services:
- Provision (Figure 20)
- Regulation (Figure 21)
- Support (Figure 22)
- Cultural (Figure 23)
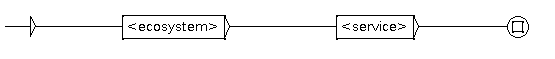
Figure 13: Ecosystem service
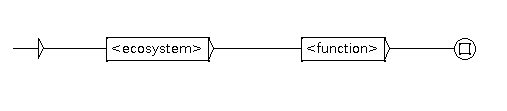
Figure 14: Ecosystem function
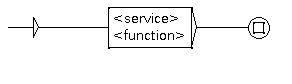
Figure 15: Service or function
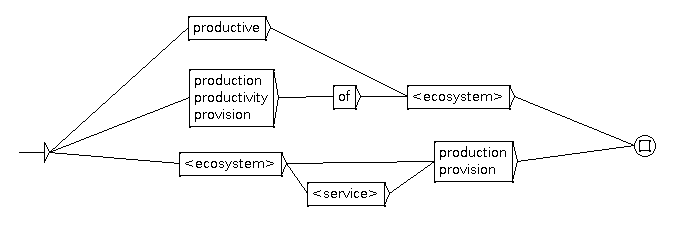
Figure 16: Production or provision of ecosystem services
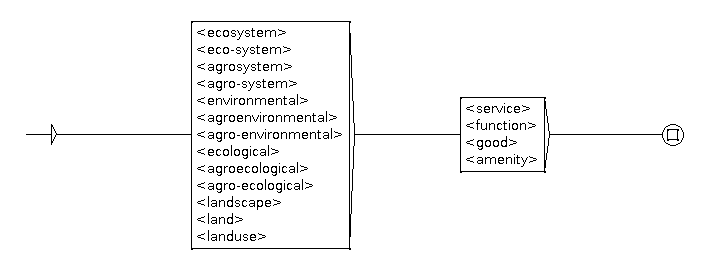
Figure 17: Query WOS
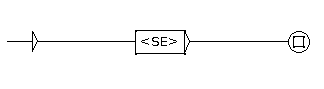
Figure 18: Ecosystem services 1
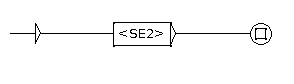
Figure 19: Ecosystem services 2
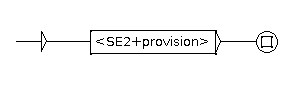
Figure 20: Provision
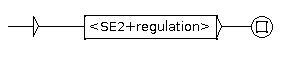
Figure 21: Regulation
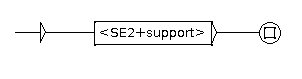
Figure 22: Support
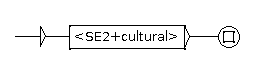
Figure 23: Cultural
2.2.2.2.5. Ecosystems
There three types of ecosystem graphs:
- graph which recognizes all occurrences of the term « ecosystem » except « ecosystem service » and « ecosystem function » (Figure 24)
- graph which recognizes all types of ecosystems (Figure 25)
- graph which recognizes the types of temperate agriculture ecosystems (Figure 26)
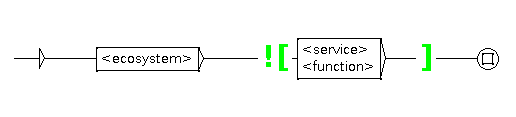
Figure 24: Ecosystem
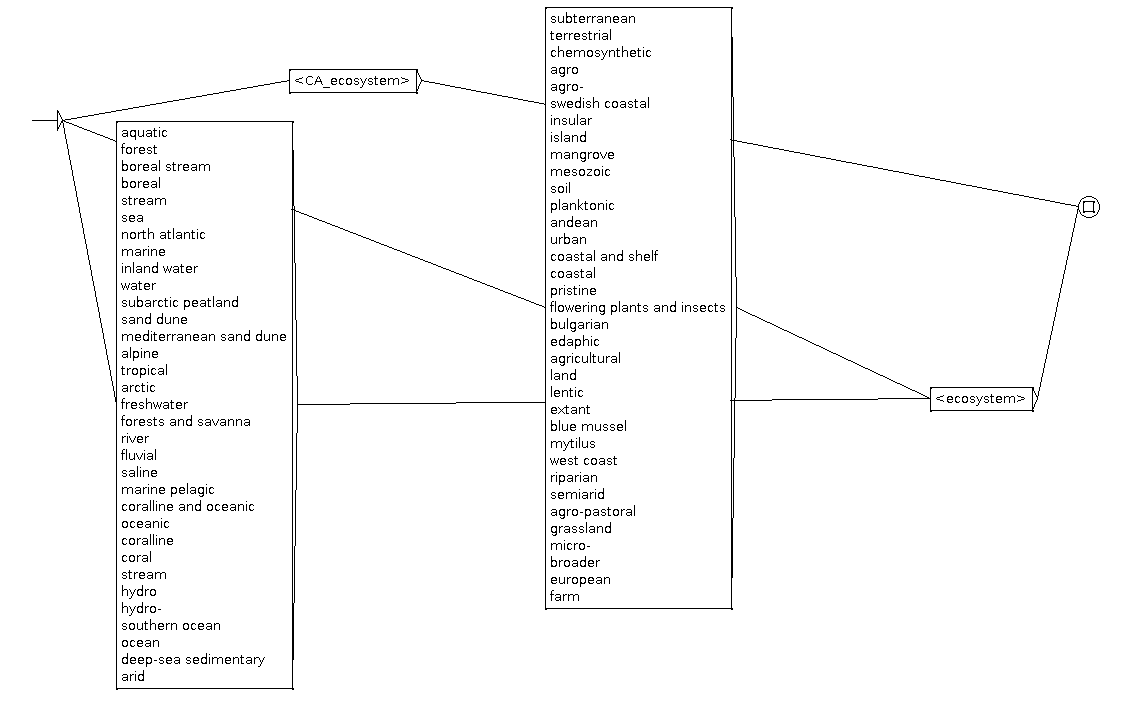
Figure 25: Types of ecosystems
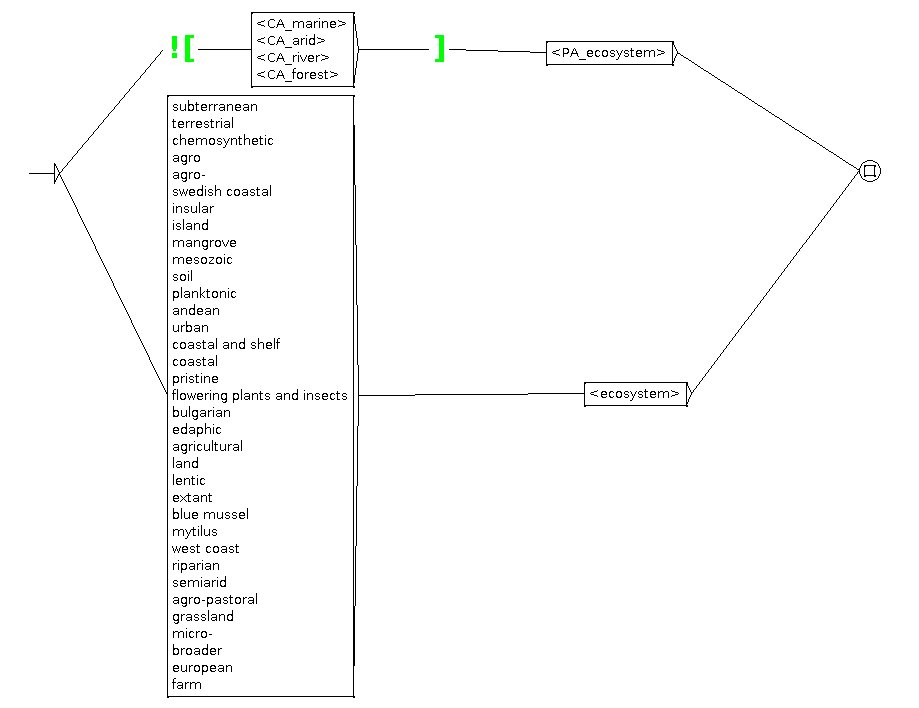
Figure 26: Types of ecosystems of temperate agriculture
2.2.2.2.6. Themes
We try to define projects which correspond to these themes:
- Agriculture (Figure 27)
- Biodiversity (Figure 28)
- Resilience (Figure 29)
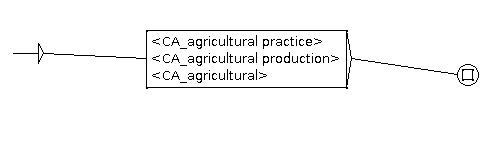
Figure 27: Agricultural
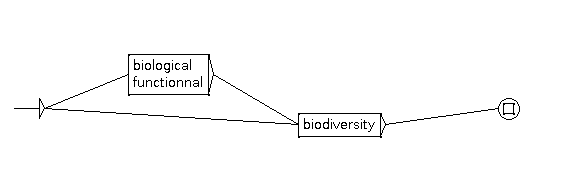
Figure 28: Bioversity
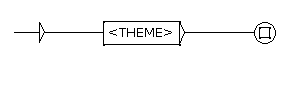
Figure 29: Resilience
2.2.2.2.7. Entities
The Tancoigne’s study have defined 8 types of ecosystem services entities:
- Actions
- Disservices
- Services
- Fields
- Management
- Organisms
- Places
- Vu
We have created 10 graphs which correspond to these categories.
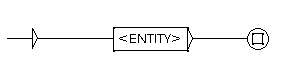
Figure 30: Entity
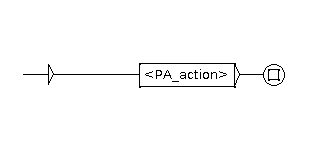
Figure 31: Actions
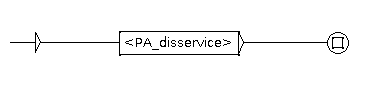
Figure 32: Disservices
Figure 33: Fields
Figure 34: Management
Figure 35: Organisms
Figure 36: Places
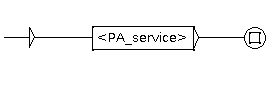
Figure 37: Services
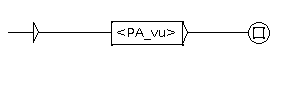
Figure 38: Vu
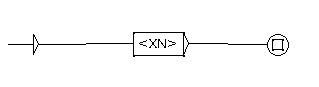
Figure 39: Composed words